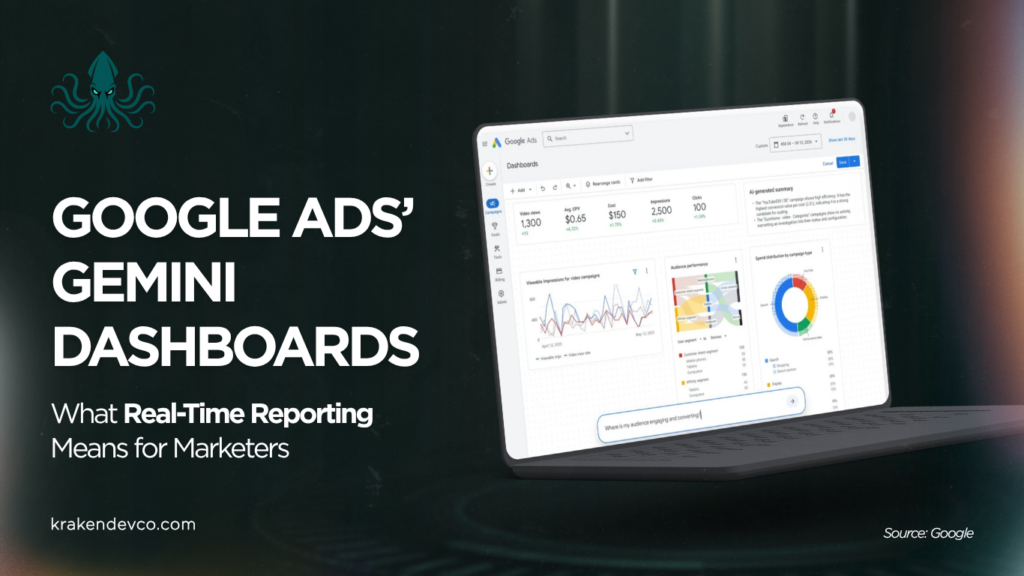
Google Ads is introducing Gemini-powered dashboards that let advertisers explore performance data using simple text prompts. Instead of building reports manually, advertisers will be able to ask questions and see charts, graphs and tables update in real time.
The dashboards show metrics such as impressions, clicks, video views and cost. They also show performance by device, audience and campaign type.
For SMEs, marketing managers and in-house teams, this could make day-to-day reporting easier to understand and quicker to act on.
Why this matters
Faster access to performance insights
Many businesses use regular reporting to check whether campaigns are attracting the right traffic, enquiries or engagement. Gemini-powered dashboards could reduce the time spent building reports manually, helping teams reach useful insights more quickly.
Easier reporting for non-specialists
Not every business owner or marketing manager wants to build custom reports from scratch. A conversational AI experience could make Google Ads data easier to explore, especially when someone needs to ask practical questions about campaign performance without moving through several reporting views.
Better visibility across campaign activity
The dashboards will show information across devices, audiences and campaign types. This is useful because campaign performance is rarely explained by one metric alone.
Looking at clicks, cost, video views and impressions together, supported by visual breakdowns, may help teams identify patterns they might otherwise miss.
What to do now
Review which Google Ads metrics matter most to your business, such as clicks, cost, impressions and video views.
Think about the questions you regularly ask when reviewing campaign performance.
Check whether your current reports are easy for business owners, directors and non-specialist stakeholders to understand.
Avoid relying on one metric in isolation, especially when reviewing campaign performance across different devices, audiences or campaign types.
Make sure your wider tracking setup supports useful decision-making, including GA4, consent and lead tracking where relevant.
Common mistake to avoid
A common mistake is treating faster reporting as the same as better decision-making.
Real-time charts and conversational dashboards may make information easier to access, but the data still needs context. Businesses should look at what the numbers mean for leads, cost and campaign quality, rather than reacting to every short-term movement.
How Kraken Dev Co can help
Kraken Dev Co can help SMEs and marketing teams review how their Google Ads, GA4 and tracking setup supports clearer reporting.
We can help identify gaps in measurement, simplify reporting views and make campaign data easier to interpret without adding unnecessary complexity.