
A Quiet but Useful Update to Google Trends
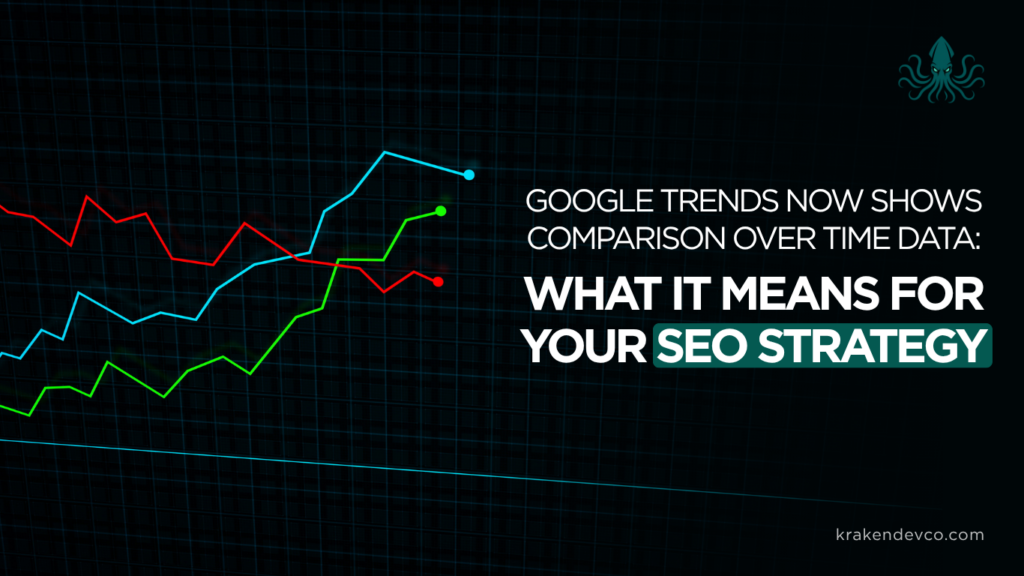
Google Trends rolled out a practical update at the start of July 2026: users can now compare search interest directly against previous time periods within the timeline view. The new feature adds percentage change figures for week-on-week, month-on-month, and year-on-year comparisons, so you no longer need to toggle between separate date ranges to understand how interest has shifted. A single click overlays the previous period’s trend line onto the current chart. It is a small but genuinely useful improvement for anyone who uses Google Trends as part of their keyword or content research.
Easier to Spot What Has Actually Changed
Spotting meaningful shifts in search demand previously required manually adjusting date ranges and comparing two separate charts. The overlay removes that friction, making it easier to judge whether a spike or dip is a one-off or part of a longer pattern. Year-on-year data is particularly useful for seasonality: knowing that interest in a topic is up compared to the same month last year tells a different story to knowing it is simply up on last week. For anyone planning editorial calendars or paid search activity, having month-on-month and week-on-week changes visible in a single view makes it easier to time content and campaigns around real shifts in demand.
Making the Most of the New Feature
- Pull up the keywords and topics most relevant to your brand and use the comparison overlay to check whether demand has shifted meaningfully over recent months. Pay particular attention to year-on-year changes, as these are often the most actionable.
- If you have been relying on historical patterns to plan seasonal content, use the year-on-year comparison to check whether those patterns still hold. Search behaviour shifts over time, and what applied two years ago may no longer be accurate.
- If you are running activity around a particular product, service, or topic, the week-on-week comparison can help you spot early changes in search interest that might inform how you adjust messaging or budget.
- Make a habit of recording trend data with screenshots or notes when you check. Reviewing Google Trends once and moving on means you lose the context that makes the next comparison meaningful.
- The overlay makes trend data more accessible to non-specialists. If colleagues in product, sales, or content need to understand shifts in search demand, this feature is now straightforward enough to walk them through.
A Word of Caution
The most common mistake with Google Trends data is treating a percentage change as confirmation of a trend rather than a prompt for further investigation. A large week-on-week spike may reflect a news event, a viral moment, or a data quirk rather than a sustained shift in interest. Always cross-reference what you see with your own analytics, keyword tool data, and relevant context before making significant decisions about content strategy or budget.
How Kraken Dev Co Can Help
If you are unsure how to incorporate tools like Google Trends into a broader SEO strategy, that is the kind of work we support. We help marketing teams make sense of search data and translate it into practical decisions around content, site structure, and visibility. If you would like to talk through how your current approach to SEO research could be improved, we are happy to have that conversation.